ATHMA Hospitals' IT Manager Rafiq described it plainly: "Managing 100s of android devices and integrating to other systems in a hospital environment was highly challenging."
An IoT device management dashboard solves this by replacing spreadsheets and one-off manual checks with a single interface showing real-time device status, health, security posture, and usage across the entire fleet. This article covers what panels to include, which metrics to track, how to set one up properly, and the common mistakes that make dashboards useless over time.
Key Takeaways
- An effective dashboard centralizes fleet health, security, app state, and lifecycle in one place - removing the blind spots that trigger costly downtime
- Actionable dashboards surface operational risk signals (what changed, what's failing, what's non-compliant) rather than raw data streams
- Critical metrics: device uptime, battery health, policy compliance rate, app version consistency, and security event counts
- Role-based access isn't optional - IT operators, security teams, and executives each need a different view of the same data
- Setup-time governance decisions - who can enroll, push policies, or wipe devices - determine whether the dashboard scales reliably
What to Include in Your IoT Device Management Dashboard
A dashboard's value isn't in showing everything - it's in surfacing what each person needs to make a decision. Every panel should connect directly to an action: investigate, remediate, or approve.
Fleet Overview Panel
The fleet overview is the first screen anyone opens. It should answer one question instantly: is my fleet healthy right now?
At minimum, this panel should show:
- Total enrolled devices and active vs. inactive count
- Devices grouped by location, department, or site
- Flagged devices requiring immediate attention
- Any compliance or connectivity anomalies at a glance
The key design principle here is aggregation by default. Displaying 500 individual device rows as the primary view is noise. Group-level summaries (by site, ward, or device group) should be the default state, with individual device drill-downs one click away - not the starting point.
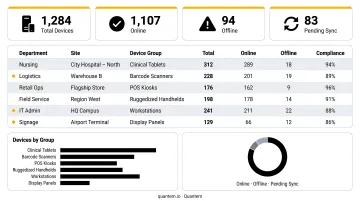
Platforms like Quantem organize devices into groups by team, department, or location. When a device is added to a group, it automatically inherits the appropriate apps, policies, and controls - which keeps the fleet overview clean and the data meaningful.
Device Health & Status Monitoring
"Health" isn't just whether a device is powered on. A healthy device is one functioning within expected parameters: connected, updated, and performing normally. Key health indicators to surface include:
- Battery level and low-battery alerts
- Connectivity status (online, offline, roaming)
- RAM and storage capacity
- OS version in use
- Last-seen or last check-in timestamp
The most dangerous failure type is the silent failure: a device that appears enrolled but has quietly stopped communicating. According to ManageEngine's MDM documentation, platforms typically mark devices inactive after 7 days without response, surfaced via the dashboard or scheduled reports.
The dashboard must catch these devices before an operator discovers the gap mid-shift.
Quantem monitors battery level, RAM, storage, and offline status in real time, with proactive alerts sent to both the device user and the IT admin when action is needed.
Security & Access Control Visibility
Security panels should show more than a simple pass/fail. IT teams need:
- Role-based access summaries (who can manage which devices or groups)
- Policy enforcement status across the fleet
- Failed authentication attempts as a risk signal
- Flagged security events by device or group
For teams in regulated industries, the compliance layer matters just as much. HIPAA's Security Rule requires access controls, audit controls, encryption, and authentication for ePHI - all of which need to be trackable on the dashboard. The consequences of gaps are real: HHS OCR's Lifespan settlement resulted in a $1,040,000 payment after a stolen unencrypted laptop triggered a HIPAA violation.
Quantem is built with SOC-2, GDPR, and CCPA compliance in mind. Its IAM-based role system enforces segregation of duties, two-factor authentication, and end-to-end audit trails. For mixed BYOD fleets, work profile separation keeps personal and corporate data distinct - which simplifies compliance visibility considerably.
Application & Policy Management Panel
App version drift is one of the most common root causes of support tickets, and one of the easiest to miss. When one location runs an outdated build, staff start calling IT for issues that look like user error but are actually software mismatches.
The app panel should display:
- Which app versions are deployed by device or device group
- Devices running unapproved or outdated builds
- Policy deployment status: applied, pending, or drifted from approved standard
This panel is especially critical in environments without on-site IT staff. Quantem's private app management feature supports version control with the ability to freeze specific app versions, stage updates before fleet-wide rollout, and block unauthorized apps - all from a centralized console. The General Manager of Roots Outdoor Timber noted: "We thought remote IT asset management is difficult and expensive. Quantem broke that with their software & ROI."
Location & Geofencing Visibility
Location data serves two distinct purposes on a device management dashboard: security and operations.
From a security standpoint, location tracking flags devices that have left approved zones, triggers alerts on unexpected movement, and enables fast response for lost or stolen hardware.
For field service, logistics, or multi-site healthcare teams, it also serves an operational role: confirming the right devices are at the right sites, and surfacing idle devices sitting at one location while another runs short.
Quantem collects location data to locate, track, and geofence devices, and this runs even when the app is closed. Location sync frequency scales by plan tier, from every 15 minutes on Essential to every 2 minutes on Enterprise, with location history retained for 7 to 30 days.
Lifecycle & Audit Trail Panel
Every device has a history: when it was enrolled, what policies were pushed, which apps were installed or removed, and when it last checked in. Lifecycle tracking turns that history into a resource for compliance, planning, and accountability.
Audit trails matter especially in compliance-heavy industries where proving what happened on a device - and when - is a regulatory requirement. Quantem retains activity logs for 1 month (Essential), 2 months (Professional), and 3 months (Enterprise), with event feed history at 7, 15, and 30 days respectively.
Lifecycle visibility also helps teams schedule updates in advance and prevents decommissioned devices from lingering in the active fleet unnoticed.
Key Metrics to Track on an IoT Device Management Dashboard
The goal isn't to log everything - it's to track the indicators that predict problems before they become incidents.
Connectivity & Uptime Metrics
These metrics surface coverage gaps and devices that have quietly dropped off:
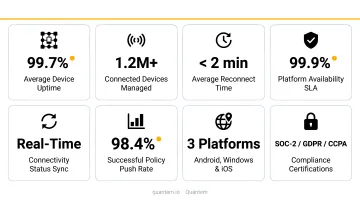
- Device uptime percentage - what share of fleet time is each device online and functional
- Time since last check-in - the primary signal for silent failures
- Network connectivity status - online, offline, or roaming
- Active vs. inactive device ratio - high inactive ratios indicate provisioning gaps or device loss
Verizon's 2025 Mobile Security Index found that 46% of organizations affected by mobile or IoT incidents reported downtime as a direct result. Connectivity metrics are the first line of defense against that outcome.
Battery & Hardware Health Metrics
Battery health is undertracked in most fleets. For deskless workers, field technicians, and clinical staff, a dead device doesn't just create inconvenience - it disrupts workflows and patient care.
Track these metrics per device:
- Current battery percentage
- Charge cycle count (indicator of degradation over time)
- Flagged devices with degraded battery capacity
Battery performance degrades with repeated charge cycles, especially at high temperatures. Industry guidance recommends recharging only when charge drops to 10% or below to reduce total cycle count. Predictive alerts on these thresholds catch failing devices before they take workers offline mid-shift.
Security & Compliance Metrics
Tracking security metrics in aggregate helps teams prioritize remediation rather than reacting to individual incidents:
- Number of policy-non-compliant devices
- Failed authentication attempts per device or group
- Devices with disabled encryption or missing passcodes
- Open security events ranked by severity
Verizon's 2025 MSI reports 85% of organizations say mobile attacks are increasing, and 84% face pressure from partners or regulators to prove mobile security maturity. Aggregate compliance metrics make that proof possible.
Application & Configuration Compliance Rate
App compliance rate measures the percentage of enrolled devices running the approved version of each required app.
Track this per app, not just fleet-wide. A 98% compliance rate looks acceptable until you realize the non-compliant 2% are all in the same hospital ward - or the same warehouse shift. Key things to monitor:
- Devices running outdated app versions by location or group
- Apps with pending required updates
- Configuration drift from approved policy baselines
Usage & Productivity Metrics
Usage data helps operations teams understand how devices are actually being deployed:
- Active usage hours per device
- App-level usage frequency
- Idle time by device or group
- Utilization rates across shifts or locations
These metrics justify hardware purchases, identify underdeployed assets, and optimize shift-based device assignments - turning the dashboard from a monitoring tool into a resource planning tool.
How to Set Up an IoT Device Management Dashboard
Dashboard setup is not just a technical task. It starts with defining who needs to see what, and why. Skipping that conversation produces dashboards that show everything but answer nothing.
Define Roles and Access Levels First
Map roles before building anything. Quantem's platform recognizes three primary personas with distinct access levels:
| Role | Primary Focus |
|---|---|
| IT/System Admin | Device deployment, policy management, provisioning |
| Software Developer | API integration, DevOps staging, bulk rollouts |
| Business Owner | Performance insights, location data, custom reports |
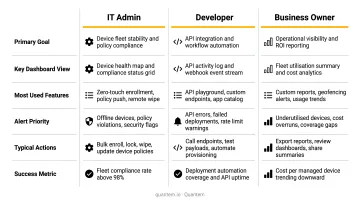
Role-based views reduce noise and improve response speed. An operator overwhelmed by security event logs they can't act on will ignore the dashboard entirely.
Plan for Fleet Scale, Not Just Current Size
Dashboards built around individual device views fail at scale. What works at 100 devices becomes unmanageable at 1,000. Plan from the start for:
- Aggregated group-level views as the default
- Exception-based alerting rather than all-event notifications
- Role-filtered views so each user only sees what's relevant to their function
Configure Alerts Around Risk, Not Raw Data
Alert overload is a real problem. According to Vectra, organizations receive an average of 2,992 security alerts daily, and between 42% and 63% go uninvestigated. The MDM equivalent is just as damaging: when every minor event triggers a notification, nothing gets acted on.
Meaningful alerts trigger on defined thresholds:
- Battery under 15%
- Device offline for more than 4 hours
- Policy compliance rate drops below a set floor
- Device moves outside an approved geofence zone
Quantem's alert tiers scale by plan: Essential covers battery and offline status; Professional adds task reminders; Enterprise adds custom event-based alerts with automated responses (lock, wipe, beep) attached directly to alert triggers.
Establish Governance and Audit Practices Early
Configure governance controls - who can enroll devices, push policies, or trigger a remote wipe - before the dashboard goes live. Adding governance after the fact to a growing fleet creates gaps.
Quantem's recommended setup sequence:
- Enroll devices via zero-touch or QR code
- Create device groups by ward, department, or role
- Push approved apps and block unauthorized ones
- Enable real-time monitoring and alert thresholds
- Configure scheduled compliance reports for audit readiness
Audit logging is available across all Quantem plan tiers, with retention increasing from 1 month (Essential) to 3 months (Enterprise). Enable it from day one. In regulated industries, retroactive compliance documentation simply isn't an option.
Common Mistakes to Avoid When Building Your IoT Dashboard
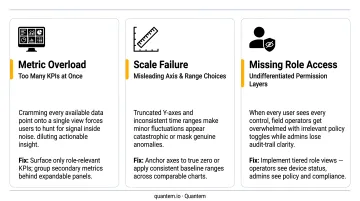
Most IoT dashboards fail not because of bad data, but because of avoidable design decisions. These three mistakes show up most often:
Metric overload: Teams that surface every available data point end up with a screen no one reads. Limit your primary view to 5–7 indicators tied directly to operational risk and decision-making, and put everything else behind a drill-down.
Designing for current fleet size: A dashboard built for 100 devices breaks at 1,000 - slow load times, unmanageable device-by-device views, and alert fatigue from non-aggregated notifications. Build for 10x your current scale from day one.
Skipping role-based access controls: When everyone sees the same view, operators get buried in security data they can't act on, and security teams miss device health signals lost in operational noise. Role-specific views are a requirement for usability at scale, not an optional upgrade.
Frequently Asked Questions
What is device analytics?
Device analytics refers to the collection, analysis, and visualization of data generated by managed devices - including usage patterns, health indicators, connectivity status, and security events. It gives IT teams data-driven insights to make informed decisions about their fleet before problems escalate into downtime.
What are the 5 functions of a device manager?
The five core functions are: device enrollment and provisioning, configuration and policy management, application deployment and updates, security enforcement (remote lock/wipe, compliance monitoring), and monitoring and reporting of device health and usage. Each function addresses a distinct phase of device ownership, from initial setup through ongoing operations.
What are the 4 types of dashboards?
The four types are operational (real-time monitoring), analytical (trend and pattern analysis), strategic (high-level KPIs for leadership), and tactical (team-level performance tracking). IoT device management dashboards typically combine operational and analytical views: real-time status alongside enough historical data to spot patterns before they become problems.
Should device management be on or off?
Device management should always be enabled on enterprise-owned IoT devices. Enabled management enforces security policies, enables remote support, and keeps devices compliant. Disabling it removes the organization's ability to protect, monitor, or control its own assets - and creates the exact blind spots that lead to breaches and downtime.
What metrics should I track on an IoT device management dashboard?
Prioritize metrics that indicate risk over those that confirm normal operation: device uptime and connectivity status, battery health, policy compliance rate, app version consistency across the fleet, and security event counts. Track these in aggregate first, with per-device drill-down ready when you need to isolate a specific issue.